内容
MNE-Python
tutorialのこの部分を試してみました。
いろいろ読み込み
いろいろ読み込んでいきます。
import
numpy as np
import
mne
from
mne.datasets import sample
from
mne.preprocessing import ICA
from
mne.preprocessing import create_eog_epochs,create_ecg_epochs
raw_fname='c:\\Users\\akira\\mne_data\\MNE-sample-data\\MEG\\sample\\sample_audvis_filt-0-40_raw.fif'
raw=mne.io.read_raw_fif(raw_fname,preload=True,add_eeg_ref=False) picks_meg=mne.pick_types(raw.info,meg=True,eeg=False,eog=False,stim=False,exclude='bads')
フィルタをかけます。独立成分分析では予め1Hzのhigh passをかけとくのがお勧めだそうです。n_jobsは並列処理です。
raw.filter(1,40,n_jobs=2) # 独立成分分析では1Hzのハイパスがお勧め。n_jobsはスレッドの数
いろいろ警告がでますが無視します。
Multiple
deprecated filter parameters were used:
phase
in 0.13 is "zero-double" but will change to "zero" in 0.14
fir_window in 0.13 is "hann" but will change to "hamming" in 0.14
lower
transition bandwidth in 0.13 is 0.5 Hz but will change to "auto" in
0.14
upper
transition bandwidth in 0.13 is 0.5 Hz but will change to "auto" in
0.14
The
default filter length in 0.13 is "10s" but will change to
"auto" in 0.14
<stdin>:1: DeprecationWarning:
Multiple deprecated filter parameters were used:
phase in 0.13 is "zero-double" but will change to
"zero" in 0.14
fir_window in 0.13 is "hann" but will
change to "hamming" in 0.14
lower transition bandwidth in 0.13 is 0.5 Hz but will change to
"auto" in 0.14
upper transition bandwidth in 0.13 is 0.5 Hz but will change to
"auto" in 0.14
The default filter length in 0.13 is "10s" but will change
to "auto" in 0.14
<Raw |
sample_audvis_filt-0-40_raw.fif, n_channels x n_times : 376 x 41700 (277.7 sec), ~123.2 MB, data
loaded>
独立成分分析をかける
独立成分分析の準備をします。オブジェクト・インスタンスを作成します。
n_components=25 # 独立成分の数
method='fastica'
random_state=23 # 乱数発生時の適当な数
ica=ICA(n_components=n_components,method=method,random_state=random_state)
print(ica)
<ICA |
no decomposition, fit (fastica): samples, no dimension reduction>
独立成分分析を適応します。計算時標本を3個飛ばしで計算し、magnetometerで5×10-12以上、gradiometerで4000×10-13以上のデータは独立成分に分けるときの計算時には無視されます。
picks_meg=mne.pick_types(raw.info,meg=True,eeg=False,eog=False,stim=False,exclude='bads')
# チャンネル選択
decim=3 # サンプルをdecim個飛ばしで独立成分分析を計算
reject=dict(mag=5e-12,grad=4000e-13)
ica.fit(raw,picks=picks_meg,decim=decim,reject=reject)
print(ica)
<ICA |
raw data decomposition, fit (fastica): 13635
samples, 25 components, channels used: "mag"; "grad">
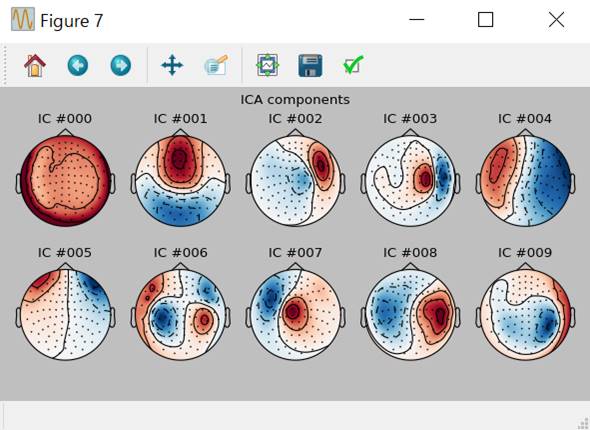
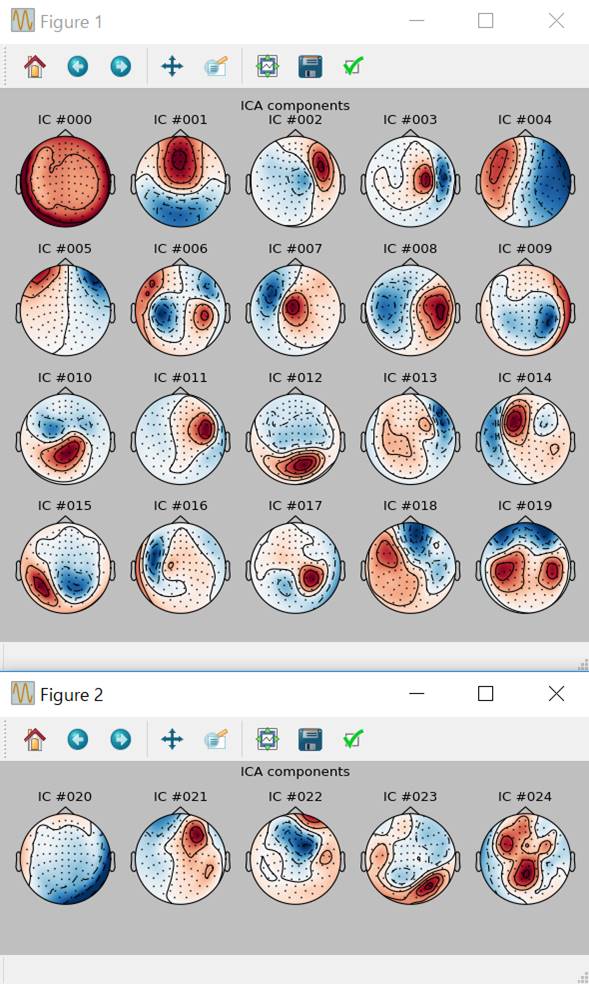
どのように独立成分に分けたかを表示します。
ica.plot_components()

たぶん1ウインドウ当たり20個までなんでウインドウが2つ開いてます。
理由はよくわかりませんがMNE-Pythonのtutorialと同じ独立成分のパターンにはなりません。
個々の独立成分を見る
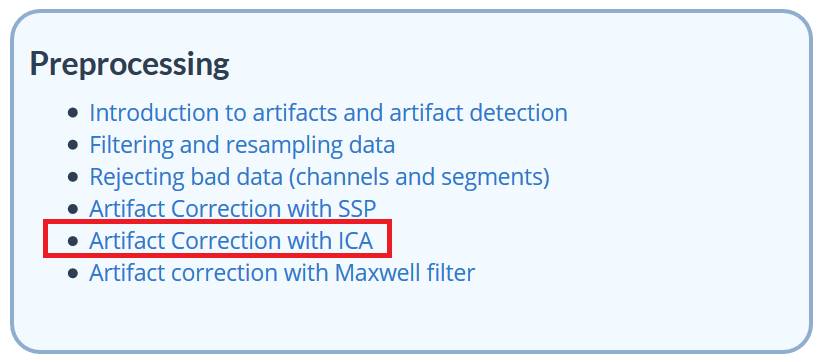
第1独立成分をみてみます。Pythonは0から始まるのでpicks=0です。
ica.plot_properties(raw,picks=0)
#第1独立成分
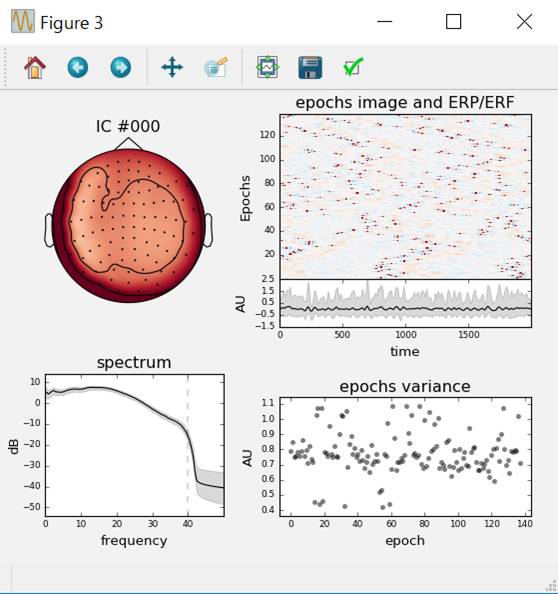
周波数帯域を0〜35Hzとします。psd_args{‘fmax’:35}という書き方になります。
ica.plot_properties(raw,picks=0,psd_args={'fmax':35})
#第1独立成分
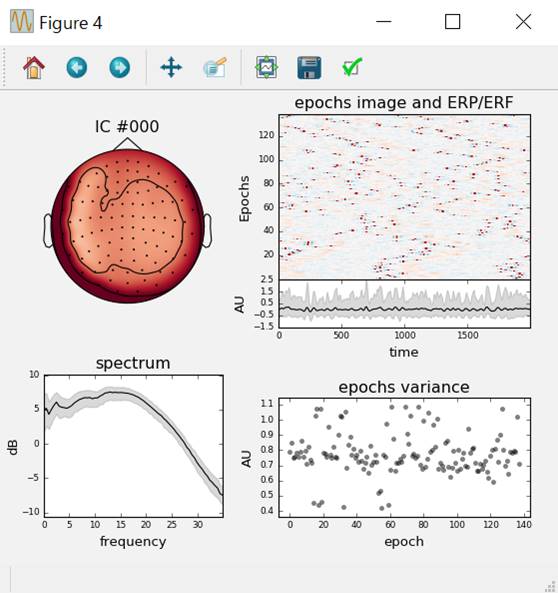
第2独立成分と第3独立成分を表示させます。
ica.plot_properties(raw,picks=[1,2],psd_args={'fmax':35}) #第2・3独立成分
いちいちica.plot_properties()を入力するのが面倒な時は以下のコマンドを使います。第1〜10独立成分を表示します。
ica.plot_components(picks=range(10),inst=raw)
第8独立成分IC #007をクリックします。

ウインドウを全部閉じます。
import
matplotlib.pyplot as plt
plt.close('all')
眼電図を使って独立成分分析
眼電図をトリガーとしたエポックを切り出します。magnetometer 5×10-12以上、gradiometer
4000×10-13以上のエポックは捨てます。このエポックを先ほど25個にわけた独立成分で表現します。
eog_epochs=create_eog_epochs(raw,reject=reject)
eog_inds,scores=ica.find_bads_eog(eog_epochs)
print(eog_inds)
[5]
Pythonは0から始まりますので第6独立成分が眼電図の影響が大きいと表示されました。
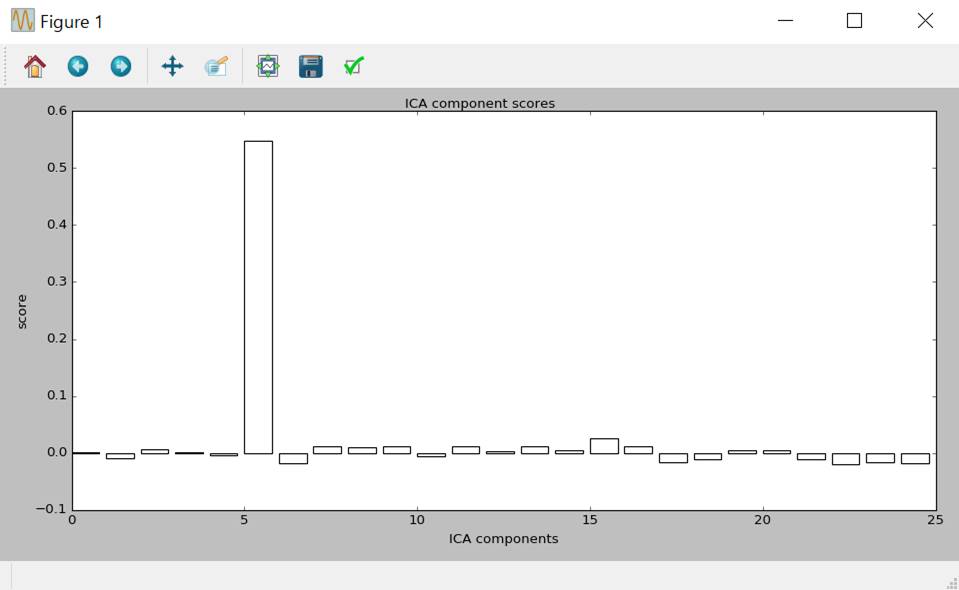
スコアを表にします。
ica.plot_scores(scores)
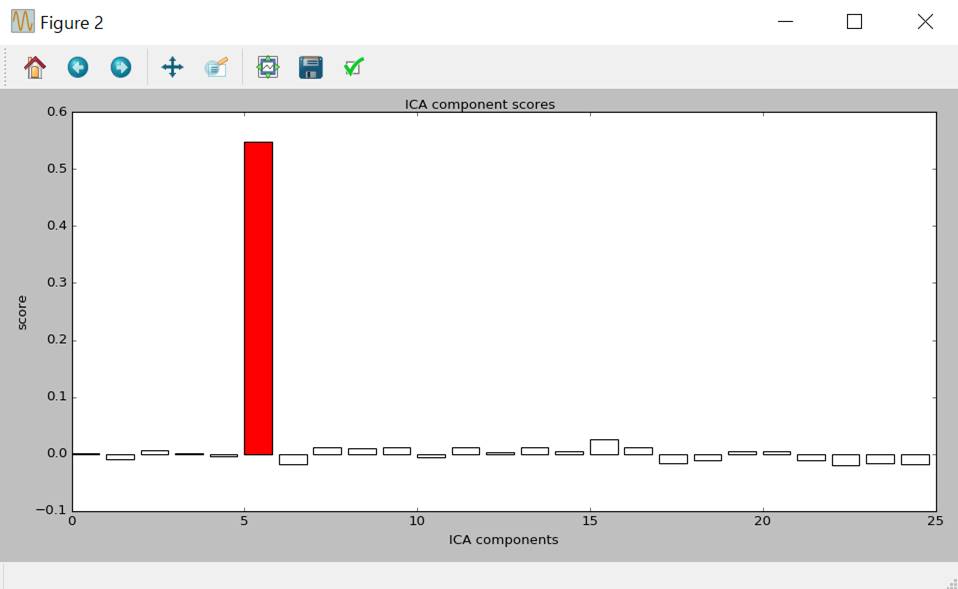
引数にexclude=eog_indsをいれるとeog_indsが赤で表示されます。
ica.plot_scores(scores,exclude=eog_inds)
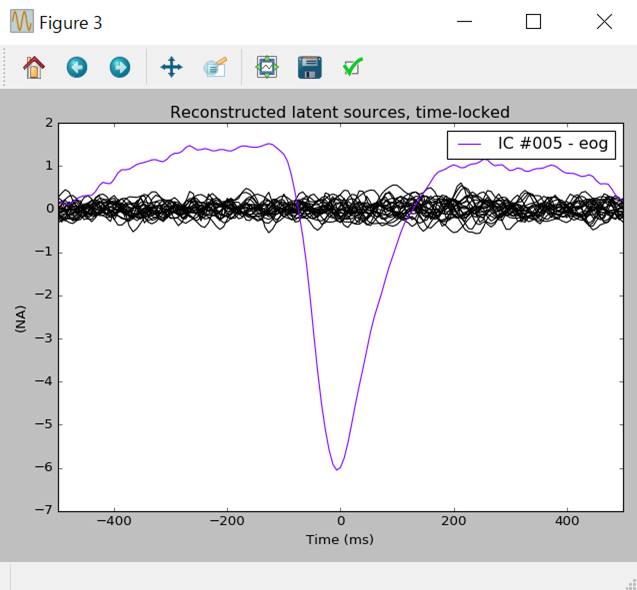
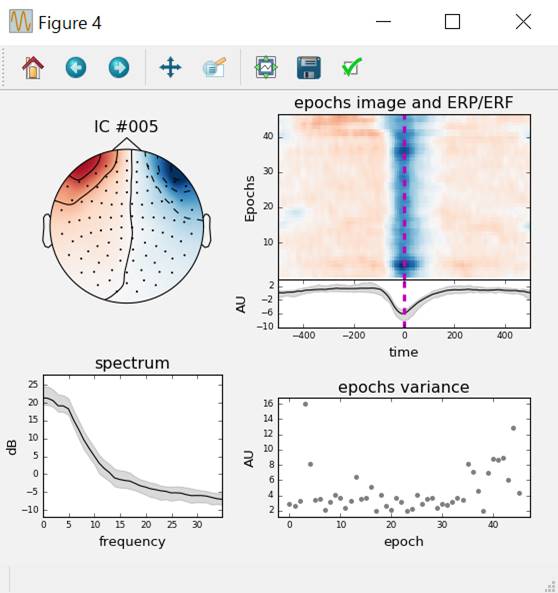
加算平均と第6独立成分 IC #005の影響を見てみます。
eog_average=create_eog_epochs(raw,reject=dict(mag=5e-12,grad=4000e-13),picks=picks_meg).average()
ica.plot_sources(eog_average,exclude=eog_inds)
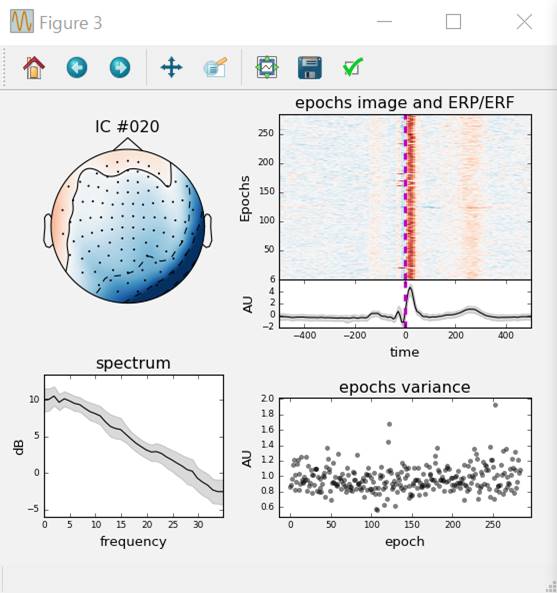
第6独立成分を細かく見ていきます。
ica.plot_properties(eog_epochs,picks=eog_inds,psd_args={'fmax':35},image_args={'sigma':1})
ラベルというのができるそうです。
print(ica.labels_)
{'eog': [5], 'eog/0/EOG 061': [5]}
MNE-Pythonのホームページと少し違いますが良しとします。
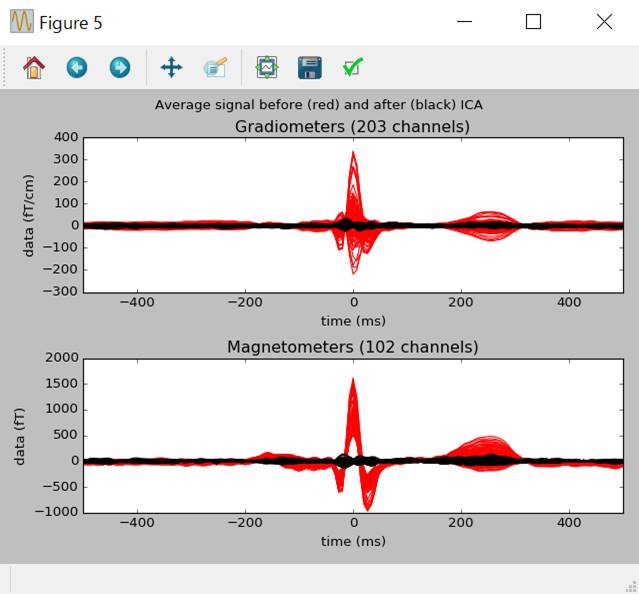
第6独立成分がある時とない時で比較します。
ica.plot_overlay(eog_average,exclude=eog_inds,show=False)
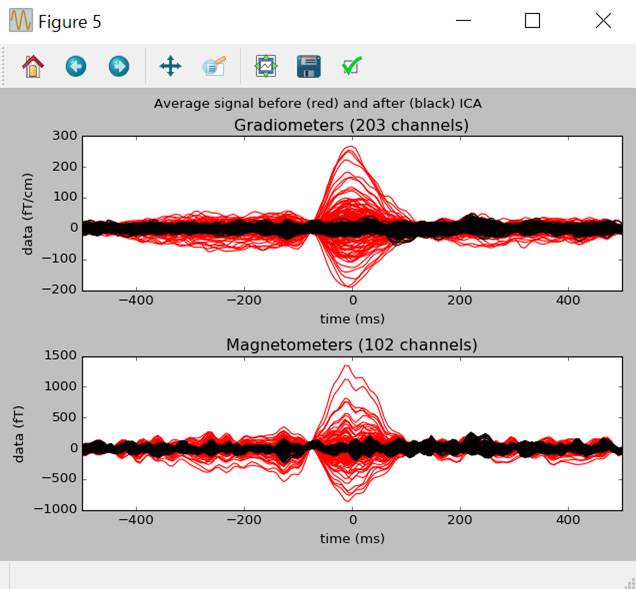
赤が第6独立成分を含んでいるとき、黒が含んでいないときです。
ウインドウを閉じます。
plt.close('all')
心電図を使って独立成分分析
心電図を使って独立成分分析を行います。心電図をトリガーとしてエポックを切り出します。
ecg_epochs=create_ecg_epochs(raw,tmin=-0.5,tmax=0.5)
ecg_inds,scores=ica.find_bads_ecg(ecg_epochs,method='ctps') #
cross-trial phase statistics
print(ecg_inds)
ica.plot_scores(scores, exclude=ecg_inds)
[0, 20, 4]
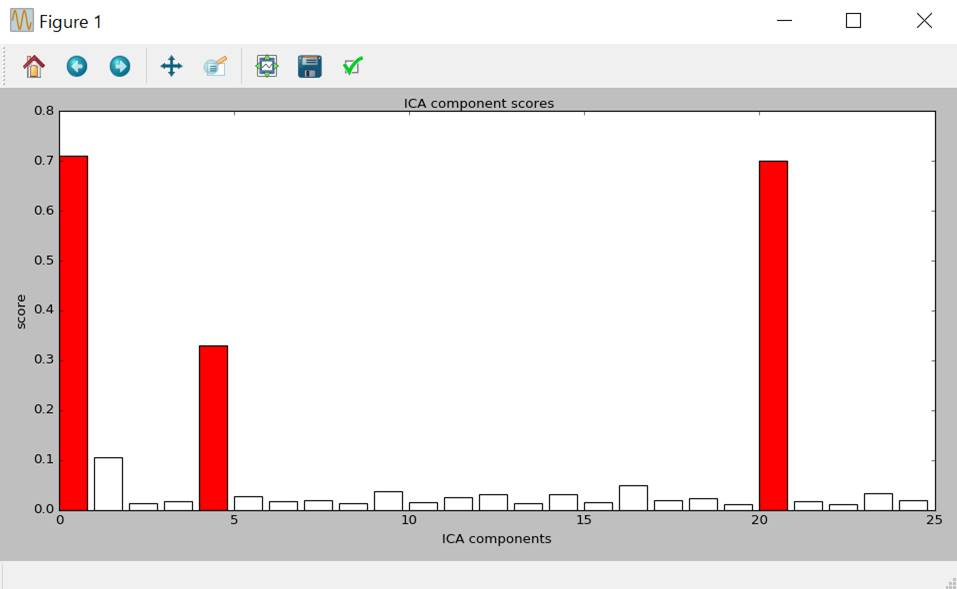
心電図に関係する独立成分は第1,21,5です。
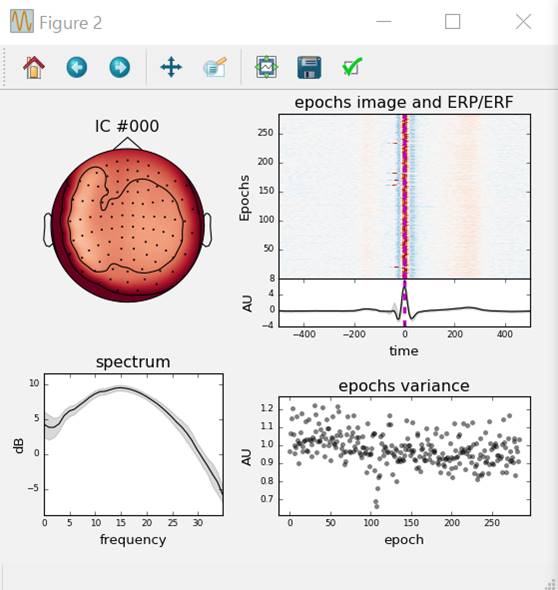
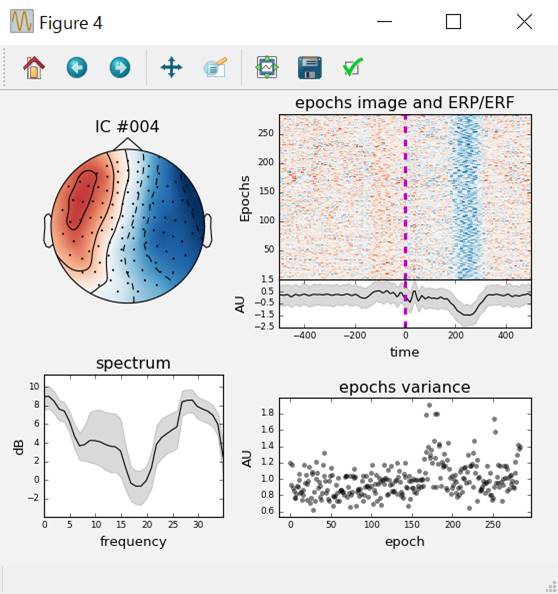
第1,21,5独立成分を見てみます。
ica.plot_properties(ecg_epochs,picks=ecg_inds,psd_args={'fmax':35.})
独立成分を引く前後の波形を見てみます。
ecg_average=create_ecg_epochs(raw,reject=dict(mag=5e-12,grad=4000e-13),picks=picks_meg).average()
ica.plot_overlay(ecg_average,exclude=ecg_inds,show=False)
ウインドウを閉じます。
plt.close('all')
眼電図がない時の独立成分分析(実行不能)
試したんですが、エラーが出ました。結局諦めました。
from
mne.preprocessing.ica import corrmap
start,stop=[0,len(raw.times)-1]
intervals=np.linspace(start,stop,4,dtype=int)
# 適当に4-1分割
icas_from_other_data=list()
raw.pick_types(meg=True,eeg=False)
for
ii,start in enumerate(intervals):
if ii+1<len(intervals):
stop=intervals[ii+1]
print('fitting
ICA from {0} to {1} seconds'.format(start,stop))
this_ica=ICA(n_components=n_components,method=method).fit(raw,start=start,stop=stop,reject=reject)
icas_from_other_data.append(this_ica)
fitting
ICA from 0 to 13899 seconds
fitting
ICA from 13899 to 27799 seconds
File "<string>", line 2, in fit
File
"C:\Users\akira\Anaconda3\lib\site-packages\mne\utils.py", line 708,
in verbose
Traceback (most recent call last):
File "<stdin>", line 5, in <module>
return
function(*args, **kwargs)
File
"C:\Users\akira\Anaconda3\lib\site-packages\mne\preprocessing\ica.py",
line 359, in fit
tstep, verbose)
File
"C:\Users\akira\Anaconda3\lib\site-packages\mne\preprocessing\ica.py",
line 419, in _fit_raw
tstep)
File
"C:\Users\akira\Anaconda3\lib\site-packages\mne\utils.py", line 525,
in _reject_data_segments
raise RuntimeError('No clean segment found. Please '
RuntimeError: No clean segment found. Please consider updating your rejection
thresholds.
try構文をつけてみました。
start,stop=[0,len(raw.times)-1]
intervals=np.linspace(start,stop,4,dtype=int) # 適当に4-1分割
icas_from_other_data=list()
for ii,start in
enumerate(intervals):
if ii+1<len(intervals):
stop=intervals[ii+1]
print('fitting ICA from {0} to {1} seconds'.format(start,stop))
try:
this_ica=ICA(n_components=n_components,method=method).fit(raw,start=start,stop=stop,reject=reject)
icas_from_other_data.append(this_ica)
except:
print(ii)
fitting ICA from 0 to 13899 seconds
fitting ICA from 13899 to 27799 seconds
1
fitting ICA from 27799 to 41699 seconds
2
3分割して最初の1つだけは実行できたようです。このままでもできそうですが、三分の一のデータしか使ってません。分割するのをやめることにしました。
start,stop=[0,len(raw.times)-1]
icas_from_other_data=list()
raw.pick_types(meg=True,eeg=False)
print('fitting ICA from {0} to {1} seconds'.format(start,stop))
this_ica=ICA(n_components=n_components,method=method).fit(raw,start=start,stop=stop,reject=reject)
icas_from_other_data.append(this_ica)
fitting ICA from 0 to 41699 seconds
無事計算終了しました。
結果を見てみます。
print(icas_from_other_data)
[<ICA |
raw data decomposition, fit (fastica): 40936
samples, 25 components, channels used: "mag"; "grad">]
個々の独立成分を見ていきます。
reference_ica=ica;
reference_ica.plot_components()
当たり前ですがica.plot_components()と同じものです。このパターンを見ればIC #005が怪しいということになります。
MNE-Pythonのホームページ通りやってみました。
template=(0,eog_inds[0])
fig_template,fig_detected=corrmap(icas,template=template,label="blinks",show=True,threshold=0.8,ch_type='mag')
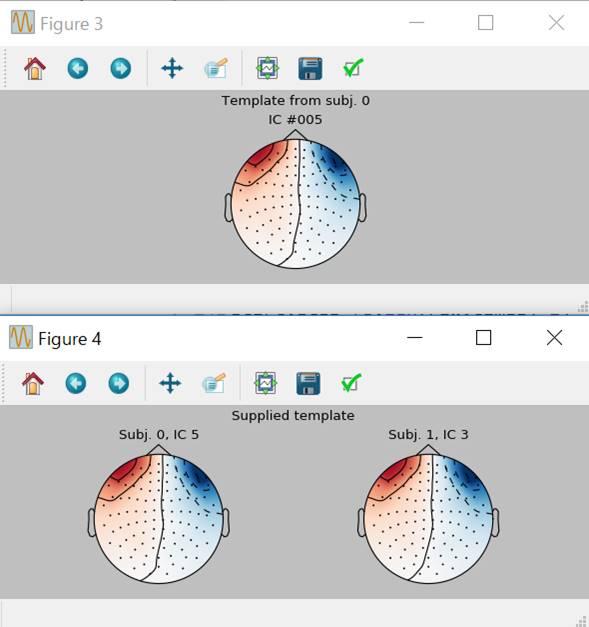
なにやら出てきました。上図は第6独立成分 IC #005そのものです。下図は・・・理解してません。