Somatosensory evoked field
Electric stimulation of median nerve at right wrist.
Interstimulus interval varied 8 - 10 seconds, electric current was 6mA,
and about 50 trials data were averaged.
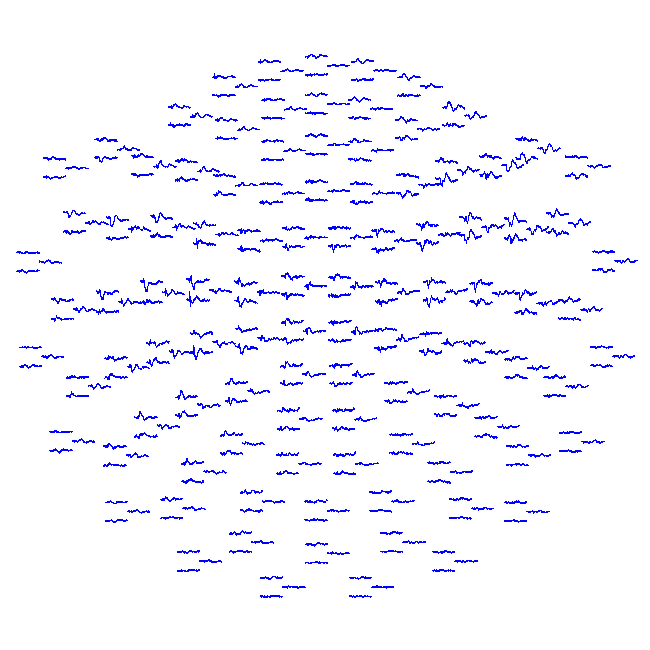
evoked field waves
isofield contour map at 21.8 msec after stimulus
estimated dipole at 21.8 msec after stimulus
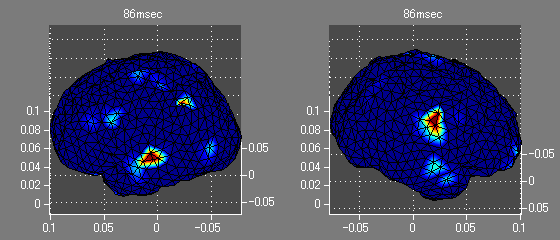
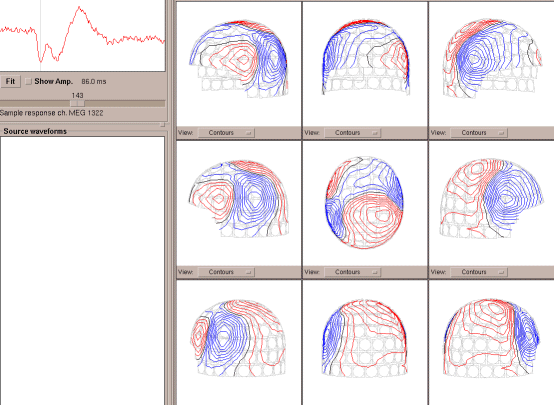
isofield contour map at 86 msec after stimlus
estimated dipoles at 86 msec
source current estimation using MCE
isofield contour map 0-300msec (GIF 2,211kB movie)
or (MPEG1 2,087kB)
movies of Minimum Current Estimation(GIF 1,599kB) or
(MPEG1 3,687kB)
evoked filed waves (top view)

Isofield contour map 21.8 msec after electric stimulus.
Inflow flux is shown in blue and outflow flux is shown in red.
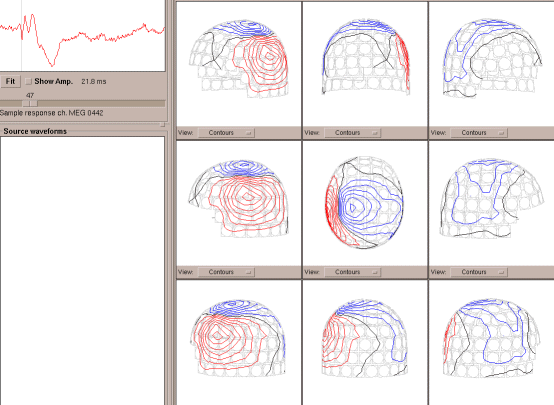
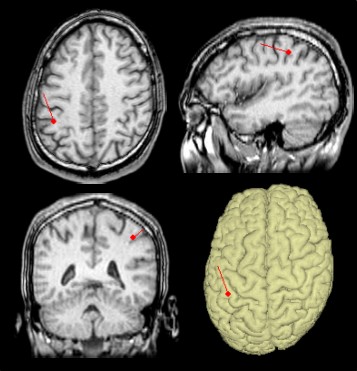
With all sensor data, a single dipole was estimated and superposed on subject's MRI.
The dipole, which is shown as red point and bar, was estimated at left central sulcus.
This red point is considered to be primary somatosensory area of the right wrist.
Isofield contour map 86 msec after electric stimulus
presenting complicated pattern of inflow and outflow.
The original evoked wave showed large magnetic change at left and right sensors.
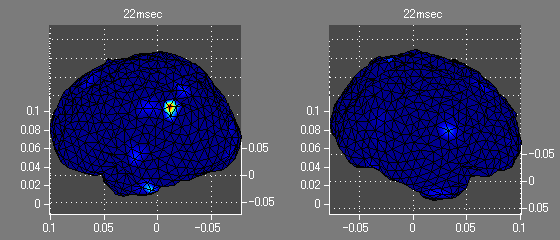
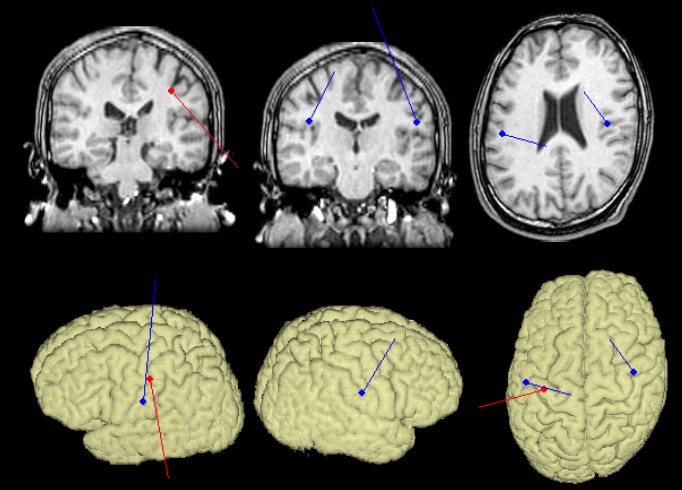
The dipole number was set to be three and electric sources were estiamted. The results were superposed on subject's MRI.
The red dipole indicates primary somatosensory area and the other blue dipoles indicate secondary somatosensory area, which were estimated bilaterally.
Source estimation by means of L1 norm spatial filter, Minimum Norm Estimation.
Estimated source at 22, 86, and 86 msec were projected to subject's brain mesh model.