mjk LISPその4
xplotter
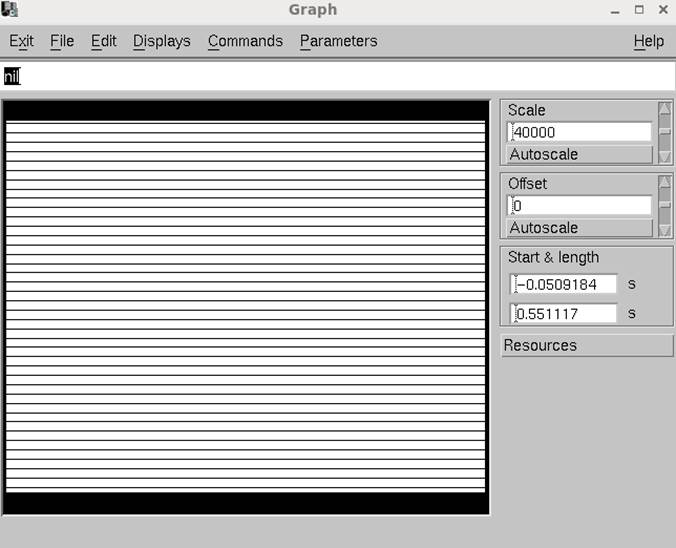
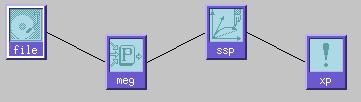
Graphを再起動します。
(progn
(setq
filename "/neuro/data/case00/SEF_median_ave.fif")
(set-resource
(G-widget "file")
:filename
filename
:dataname "*"
)
(link (G-widget
"file")(G-widget "display"))
)
nil
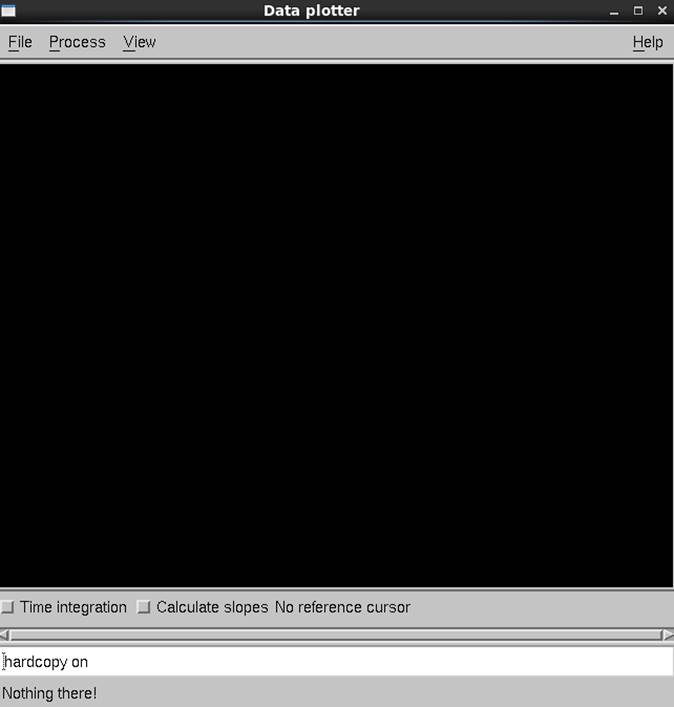
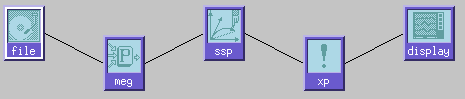
control-panelを開き、displayとのリンクを切って、xplotteを起動します。
xplotterはG-widgetではcommandというtypeになっています。また起動に癖があり、いろいろ試したら以下の順番だとエラーなしで起動できました。どうも(xplotter-show-data *this*)という文言があるとダメみたいです。
(progn
(manage
*control-panel*)
(GtUnlinkWidget
(G-widget "file"))
(setq
xp (require-widget :command "xp"))
(require "xplotter")
(set-resource xp
:active
nil
:require-hook nil
:activate-hook '(xplotter *this*)
:deactivate-hook '(kill-xplotter *this*)
;:update-hook '(xplotter-show-data *this*)
)
(link (G-widget
"file") xp)
(set-resource xp :active t)
)
t
一旦xplotterを起動した後で(xplotter-show-data
*this*)を実行すると波形が表示されます。
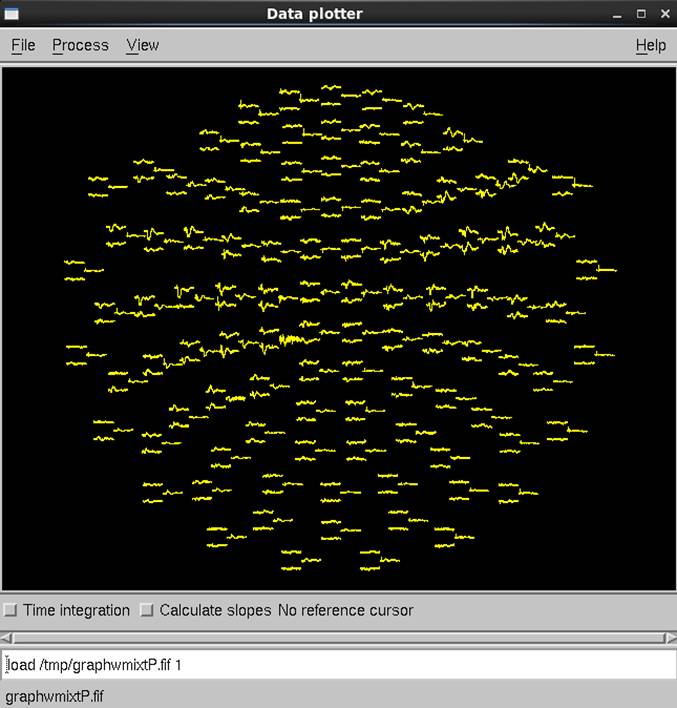
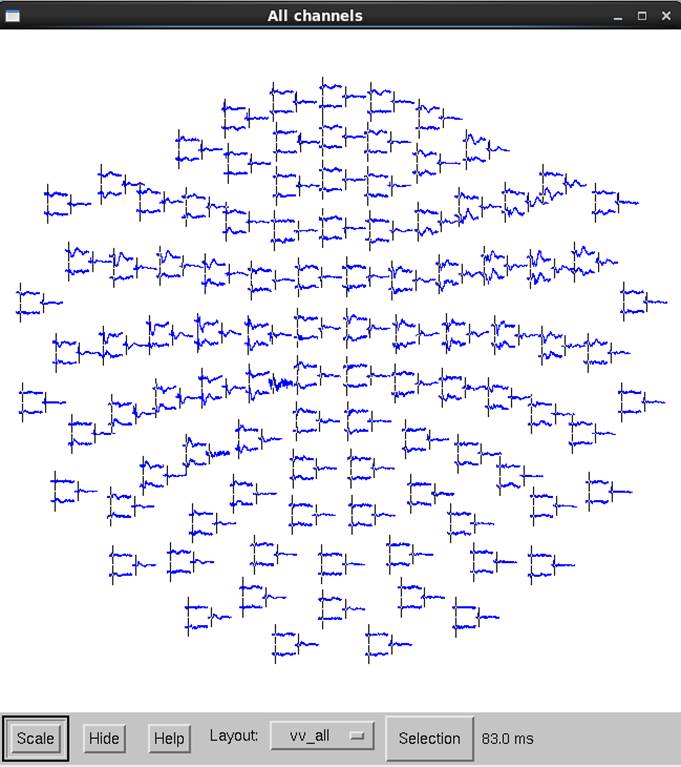
(xplotter-show-data *this*)
0
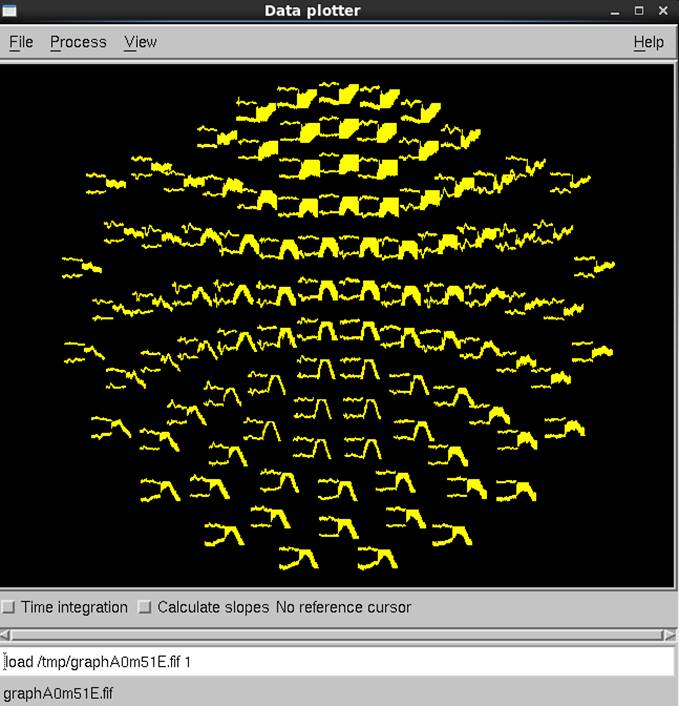
SSPがかかってない状態で表示されています。magnetometerの波形がscale outしています。
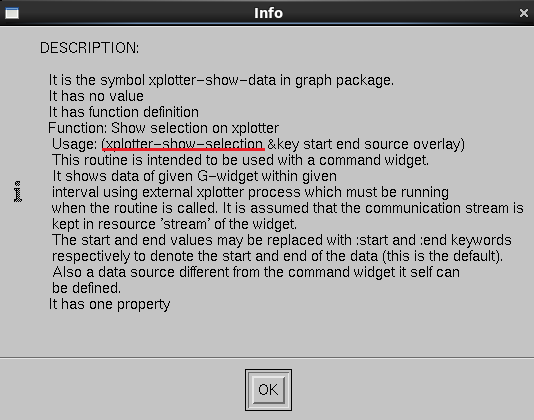
因みにxplotter-show-dataのUsageみてみると(xplotter-show-selectionになってます。
これが原因で先ほどのprogn以下の実行文にxplotter-show-dataを含んでも実行されないのかもしれません。
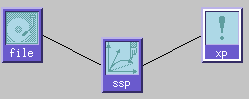
SSP
SSPを適応します。ssp.lspを読み込みます。
(progn
(require "ssp")
(setq
ssp (G-widget "ssp"))
(link (G-widget
"file")ssp)
(link ssp xp)
)
nil
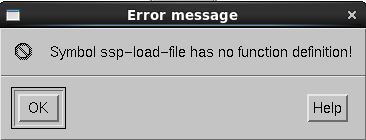
ssp.lspを参考にして試みますが、うまくいきません。
(ssp-load-file :filename
"/neuro/data/case00/SEF_median_ave.fif")
この後sspのmjk LISPコマンドでいろいろ実行したかったのですが、どうもよくわからないのでssp-dialogを開いてメニューバー操作とします。
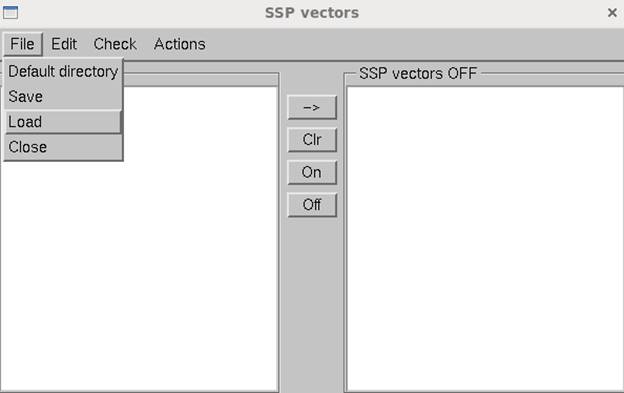
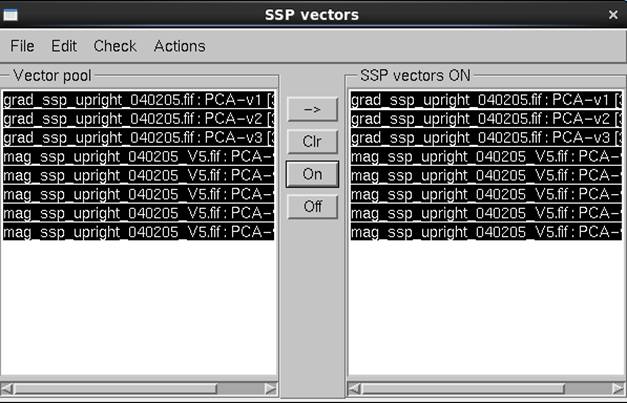
(ssp-popup)
#<X-widget>
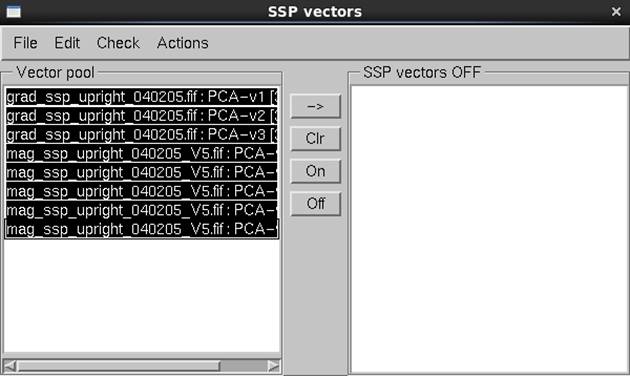
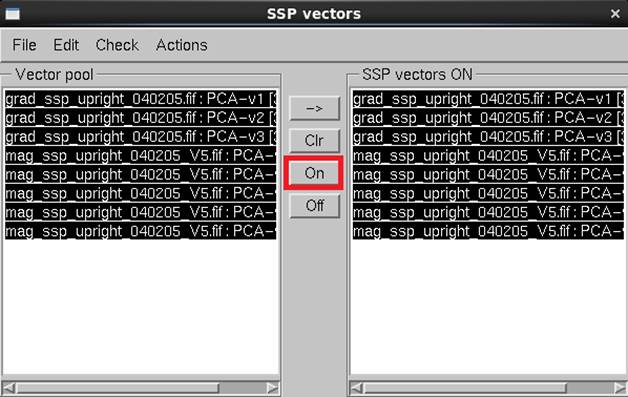
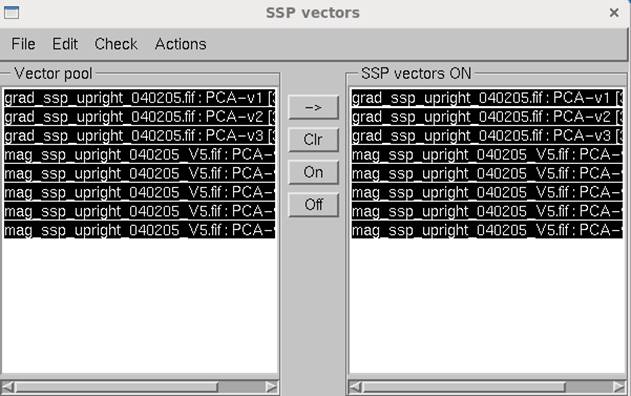
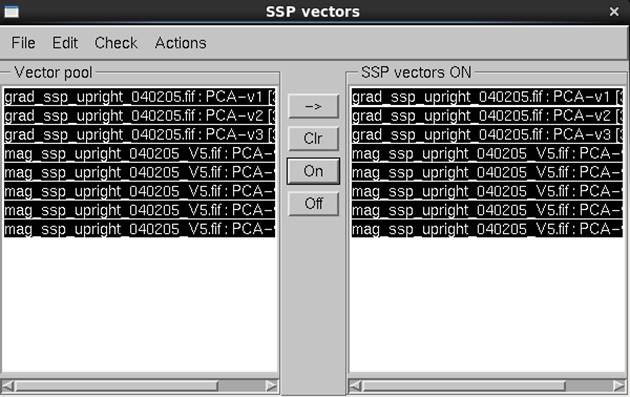
File→Loadで最初に読み込んだファイルそのものを選択します。
SSPファイルが出てきます。全部選んで->を押します。
SSPが右にも表示されますが・・・
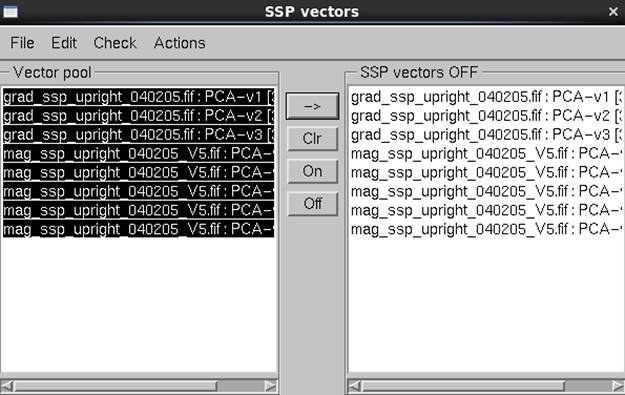
チャンネル数が合わないとエラーが出ます。
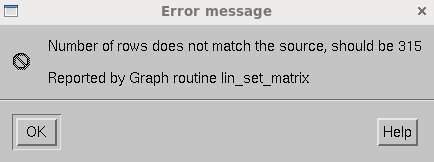
チャンネル数を合わせます。pick widgetを使います。
(progn
(setq
meg (require-widget :pick "meg"))
(set-resource meg
:names '("MEG*"))
(link (G-widget
"file")meg)
(link meg ssp)
(resource meg
:channels)
)
306
->を押してもエラーは出ませんが、xplotterは変わりません。
SSP vectors ONを選択してOnを押してもxplotterの画面は変わりません。
kill-xplotter関数でxpを除去して、再度作成し、リンクを繋ぎます。
(progn
(kill-xplotter *this*)
(GtDeleteWidget
xp)
(setq
xp (require-widget :command "xp"))
(set-resource xp
:active
nil
:require-hook nil
:activate-hook '(xplotter *this*)
:deactivate-hook '(kill-xplotter *this*)
)
(link ssp xp)
(set-resource xp :active t)
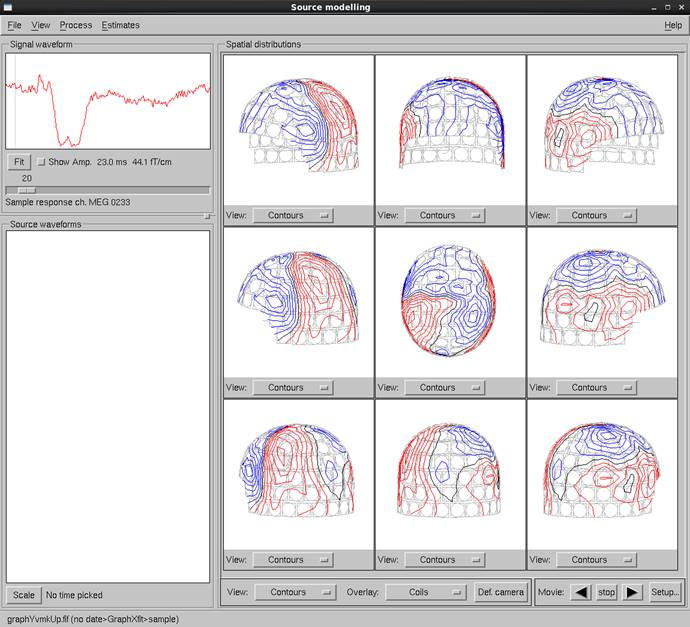
(xplotter-show-data
*this*)
)
0
SSPがかかった状態でxplotterに表示されました。
もし
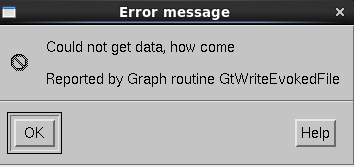
が出たらONをおして再度上記を実行してください。
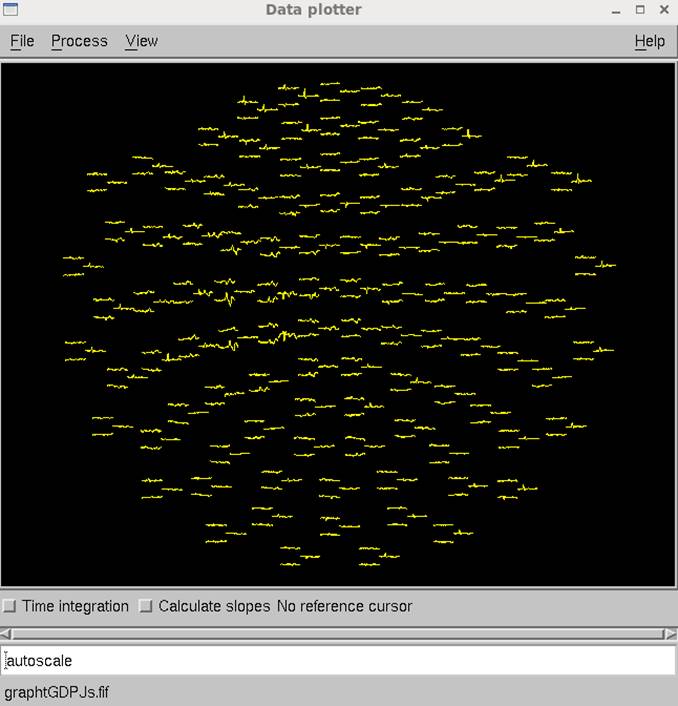
-20〜50msecを表示します。
(progn
(xplotter-show-data
xp :start -0.02 :end 0.05)
(setq
stream (resource xp :stream))
(xplotter-command
"autoscale" stream)
)
“OK”
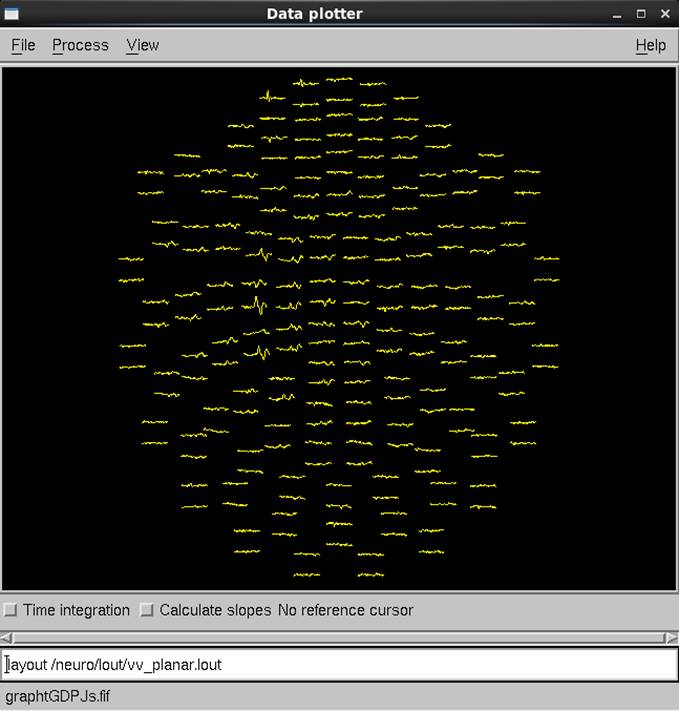
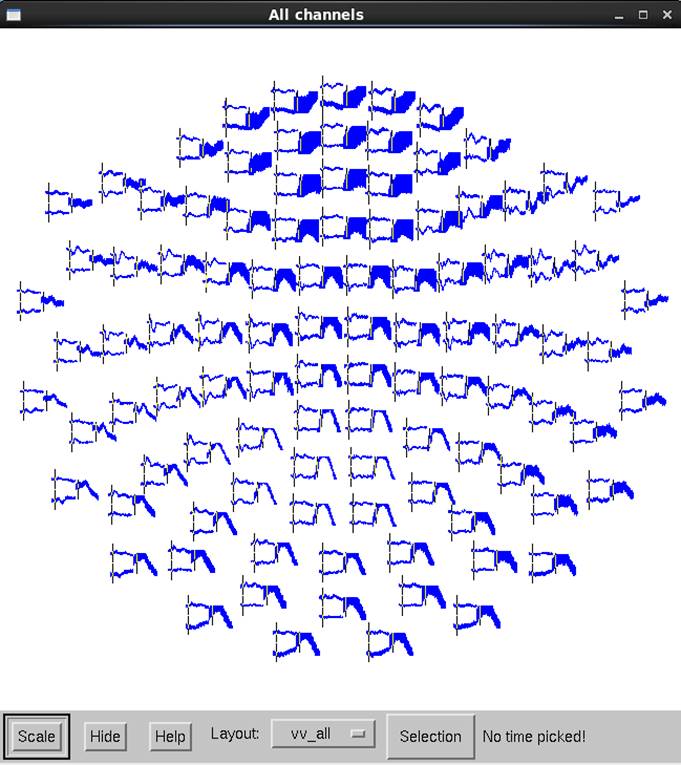
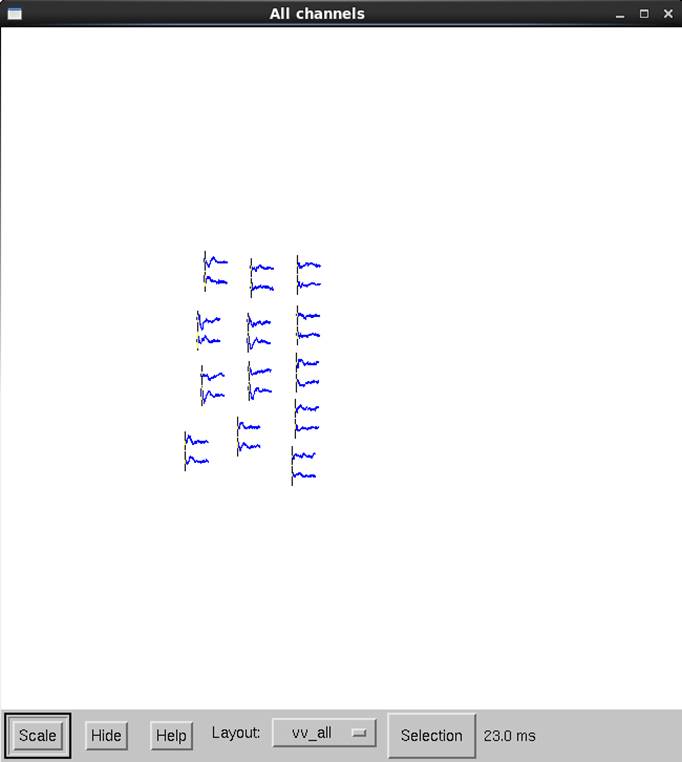
平面型グラジオメータだけ表示します。
(xplotter-command
"layout /neuro/lout/vv_planar.lout" stream)
“OK”
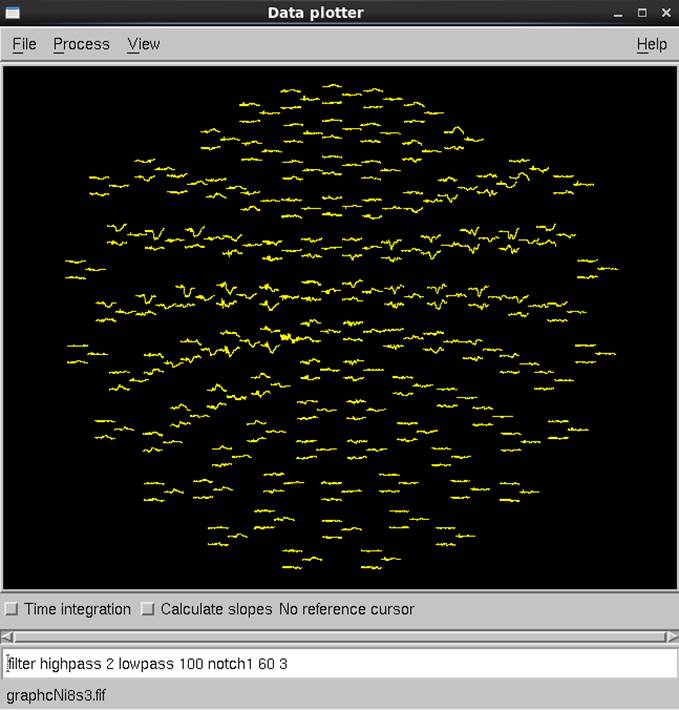
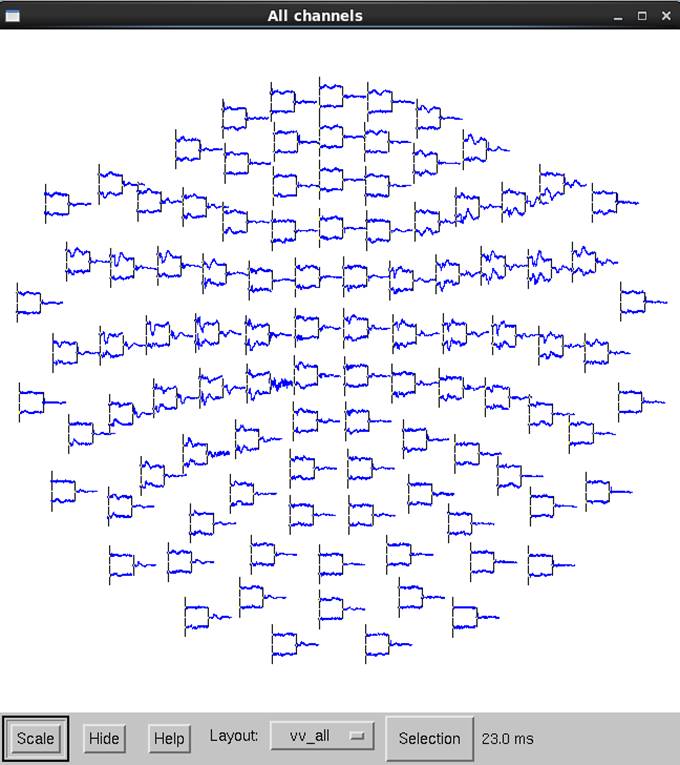
全センサを選んで、-0.05〜0.2秒を表示させ、時間幅・振幅を自動調整し、2〜100Hzの帯域通過フィルタ、60Hzで幅3Hzのnotchフィルタをかけます。
(progn
(xplotter-command
"layout /neuro/lout/vv_all.lout" stream)
(xplotter-show-data
xp :start -0.05 :end 0.2)
(xplotter-command
"autoscale" stream)
(xplotter-command
"filter highpass 2 lowpass 100 notch1 60 3"
stream)
)
“OK”
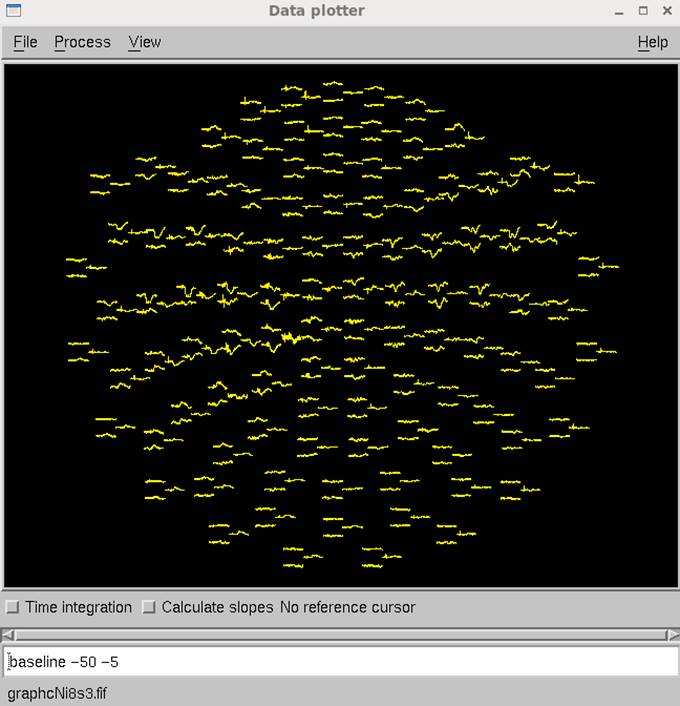
周波数フィルタをOFFにしてbaselineを-50〜-5msとします。
(progn
(xplotter-command
"filter off" stream)
(xplotter-command
"baseline -50 -5" stream)
)
“OK”
残念ながらxplotterでかけたfilterやbaselineはget-data-matrix関数で取得することはできません。
baselineあり、なしで差分をとって最大値・最小値を表示させます。
(progn
(setq
x (list (resource xp :low-bound)(resource xp :high-bound)))
(setq
x1 (get-data-matrix xp (first x)(second x)))
(xplotter-command
"baseline off" stream)
(setq
x2 (get-data-matrix xp (first x)(second x)))
(matrix-extent (- x1
x2))
)
( 0.0 0.0)
念のためG-widget “display”を繋いで試してみます。
(progn
(link xp (G-widget "display"))
(xplotter-command
"baseline -50 -5" stream)
(setq
x (list
(resource
(G-widget "display") :low-bound)
(resource
(G-widget "display") :high-bound))
)
(setq
x1 (get-data-matrix (G-widget "display") (first x)(second x)))
(xplotter-command
"baseline off" stream)
(setq
x2 (get-data-matrix (G-widget "display") (first x)(second x)))
(matrix-extent (- x1
x2))
)
( 0.0 0.0)
xplotterでの信号処理した結果はmjkLISPには出力されないようです。
因みに
x
(0 553)
(sample-to-x (G-widget "display")(first x))
0.0
ですが、
(resource (G-widget "display") :point)
-0.0509184002876
とpointは0になっていません。
xfit
Graphを再起動します。
(progn
(setq
file (G-widget "file"))
(setq
meg (require-widget :pick "meg"))
(set-resource meg
:names '("MEG*"))
(require 'ssp)
(setq
ssp (G-widget "ssp"))
(setq
display (G-widget "display"))
(link file meg)
(link meg ssp)
(link ssp display)
(setq
filename "/neuro/data/case00/SEF_median_ave.fif")
(set-resource file
:filename filename :dataname
"*")
)
t

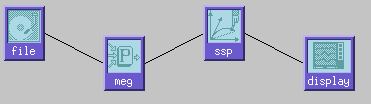
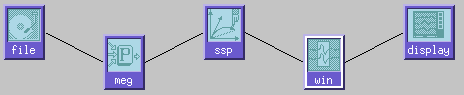
control panelはこんな感じです。
sspをonにします。
(progn
(setq
ssp-vector-directory "/neuro/data/case00/")
(ssp-popup)
)
#<X-widget>
リンクを繋ぎなおし、xfitを読み込みます。
(progn
(link ssp display)
(require 'xfit)
)
(("pca" progn
(make-menu ssp-actions-menu "Add
PCA fields" nil
'(" 1
vector" (graph::ssp-add-pca
1))
'(" 2
vectors" (graph::ssp-add-pca
2))
'(" 3
vectors" (graph::ssp-add-pca
3))
'(" 5
vectors" (graph::ssp-add-pca
5))
'(" 8
vectors" (graph::ssp-add-pca
8))
'("12
vectors" (graph::ssp-add-pca
12))
'(" N
vectors" (graph::ssp-add-pca)))
))
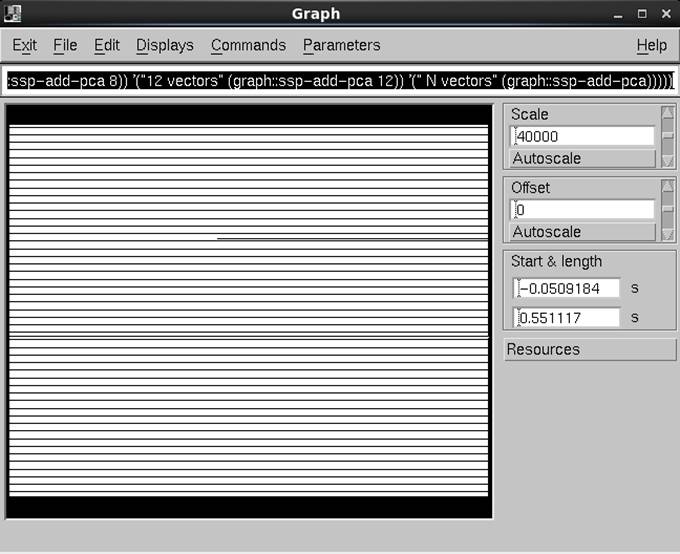
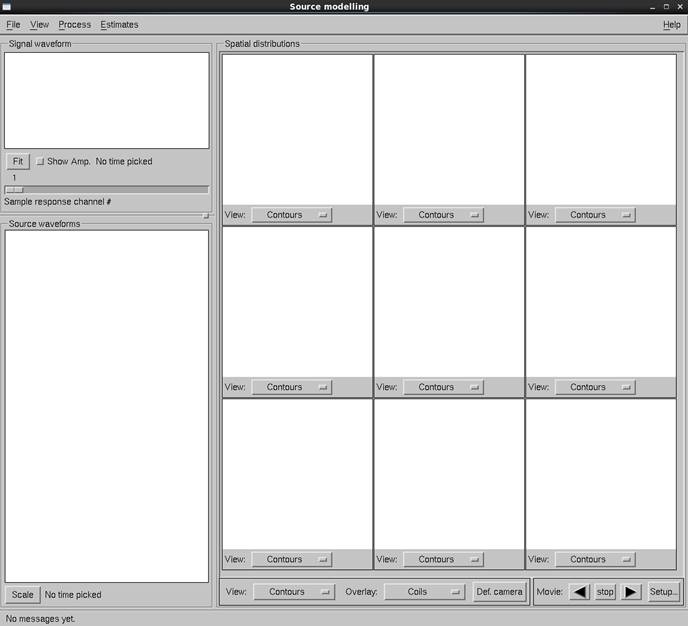
xfitを起動します。
(xfit)
" OK xfit will soon appear on
10.151.150.86:0.0"
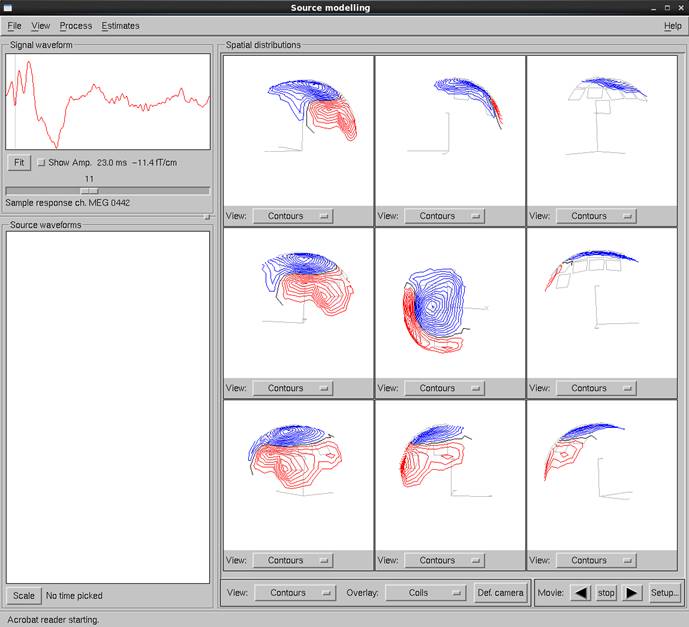
-0.05〜0.5秒をxfitに転送し、頭座標の中心座標を-3.48、12.00、44.75mmとし、23msecの等磁場線図を表示させます。
(progn
(set-resource display
:selection-start -0.05
:selection-length 0.5
)
(xfit-command
"fixorigin")
(xfit-transfer-data)
(xfit-command
"origin head -3.48 12.00 44.75")
(xfit-command
"pick 23")
(xfit-command
"fullview")
)
" OK"
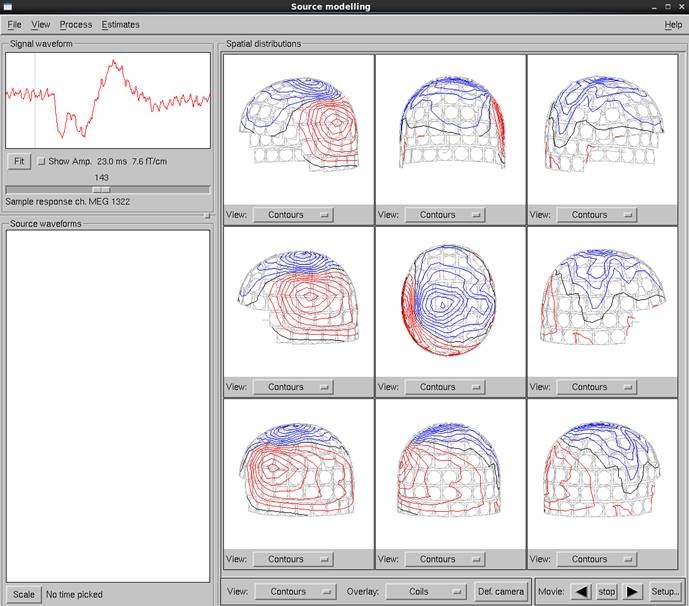
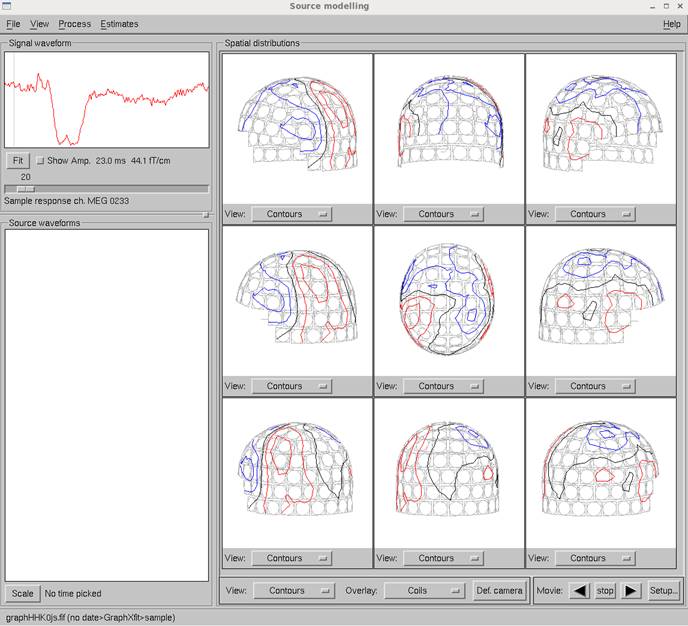
fullviewで見てみるとSSPはかかっていません。
default-data-sourceを”meg”から”display”に変更し、xfitにデータを送ります。
(progn
(setq
default-data-source "display")
(xfit-transfer-data)
(xfit-command
"fullview")
(xfit-command
"pick 23")
)
“OK”
SSPはかかりましたが、23msecにはなっていません。
Scalesを見てみます。Time minが0.0msecになっていまs。
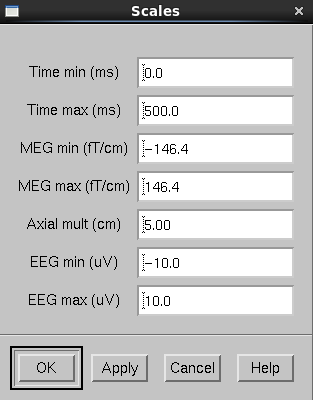
−50msecから始まっているので50+23msecを表示させます。
(xfit-command “pick 83”)
“OK”
これはbugです。x-selectionを0〜500msecとしてxfitに転送し、23msecを選択します。
(progn
(set-resource display
:selection-start 0.0
:selection-length 0.5
)
(xfit-transfer-data)
(xfit-command
"pick 23")
)
“OK”
時間が全然変わってません。
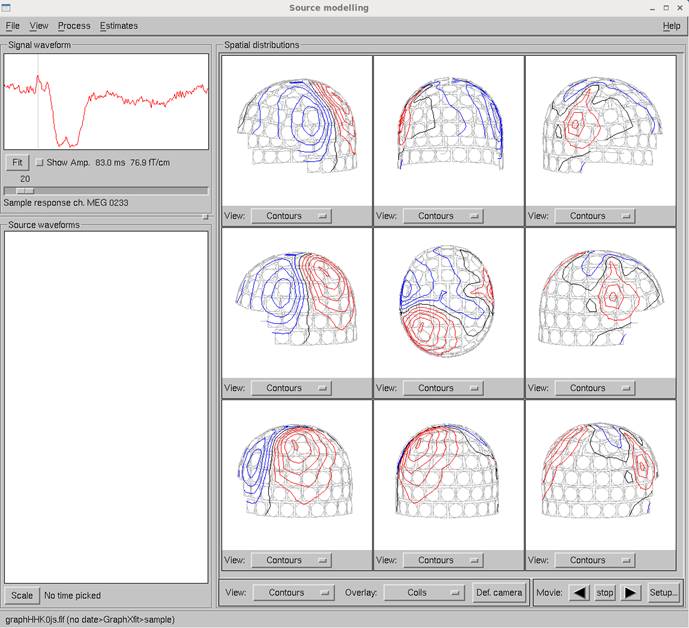
以下のようにdata-window widgetを間にいれることで時間軸を変えていきます。
(progn
(setq
win (require-widget :data-window "win"))
(set-resource win
:point 0.05 :start 0 :end 0.5)
(link ssp win)
(link win display)
(set-resource display
:selection-start 0.0
:selection-length 0.5
)
(xfit-transfer-data)
(xfit-command
"pick 23")
)
“OK”
なんかいい感じです。

ここで電流源推定します。
(xfit-command “fit 23”)
“OK”
全チャンネルを使ってるんでg/%は58.9%にとどまっています。
std-selections.lspを読み込み、以下のようにします。
(progn
(require
'std-selections)
(setq
pick (G-widget "pick"))
(link win pick)
(link pick display)
;(use-selection
"Vectorview" "left-parietal" pick
display)
)
nil
センサを選択するのですが、mjk LISPで以下のようにします。
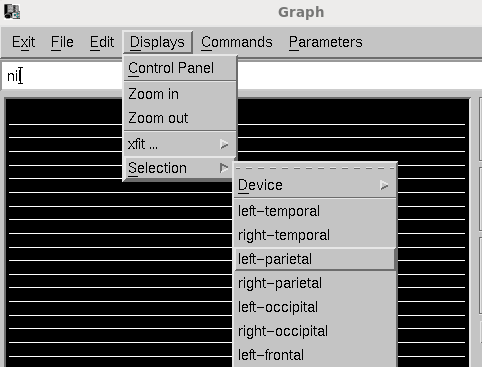
(use-selection "Vectorview"
"left-parietal" pick display)
nil
データをxfitに転送して電流源推定を行います。
(progn
(set-resource display
:selection-start 0.0
:selection-length 0.5
)
(xfit-transfer-data)
(xfit-command
"pick 23")
(xfit-command
"fit 23")
(xfit-command
"fullview")
)
“OK”
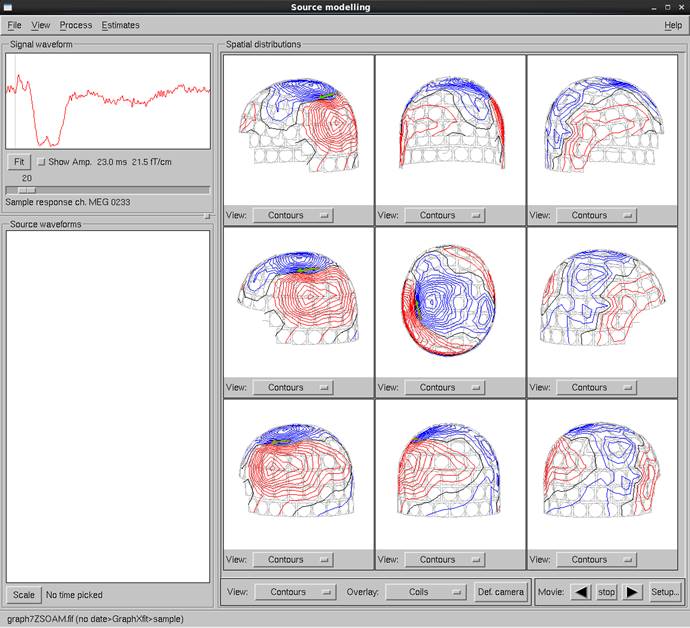
選択されたセンサのみが表示されます。
g/%は90.3%となりました。
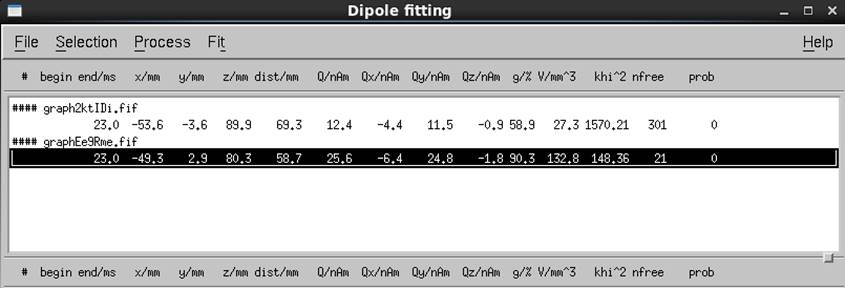
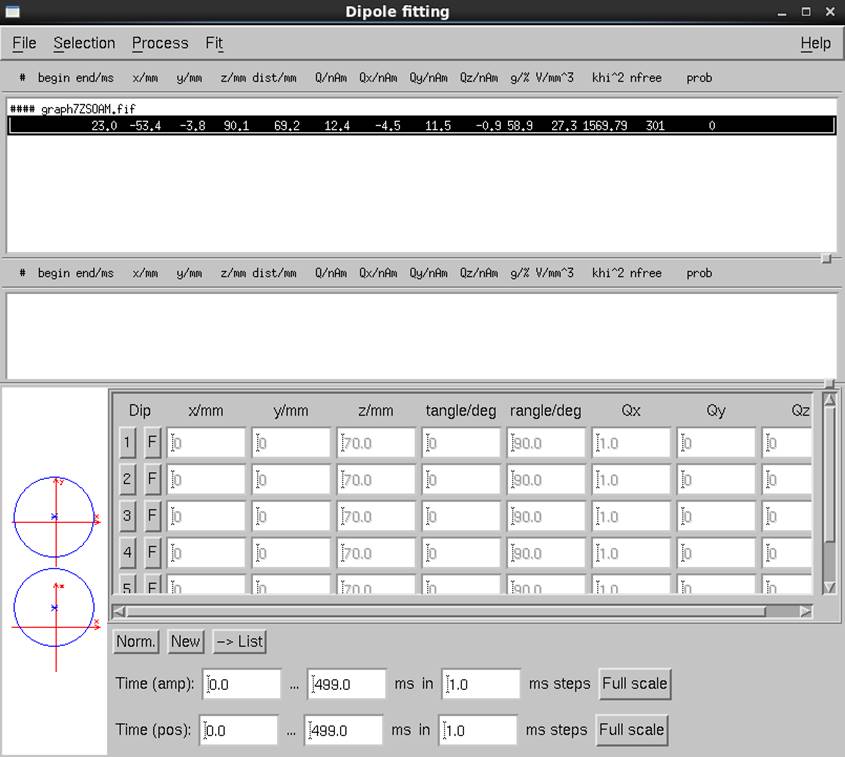
/neuro/data/case00/dipole.bdipという名前で電流双極子を保存します。
(xfit-command "dipsave
/neuro/data/case00/dipole.bdip")
“OK”
ごちゃごちゃしたんで清書します。いったんGraphを閉じます。
(exit)

Yesを押します。
(progn
(setq
file (G-widget "file"))
(setq
filename "/neuro/data/case00/SEF_median_ave.fif")
(set-resource file
:filename filename :dataname
"*")
(setq
display (G-widget "display"))
(setq
meg (require-widget :pick "meg"))
(set-resource meg
:names '("MEG*"))
(require 'ssp)
(setq
ssp (G-widget "ssp"))
(setq
win (require-widget :data-window "win"))
(set-resource win
:point 0.05 :start 0 :end 0.5)
(setq
baseline (require-widget :baseline "baseline"))
(set-resource
baseline :start -0.05 :end -0.01)
(setq
fil (require-widget :fft-filter
"bandpass"))
(set-resource fil
:pass-band '(band-pass 2 100))
(require
'std-selections)
(setq
pick (G-widget "pick"))
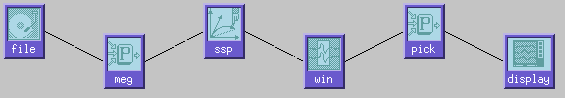
(link file meg)
(link meg ssp)
(link ssp win)
(link win baseline)
(link baseline fil)
(link fil pick)
(link pick display)
(require 'xfit)
(setq
default-data-source "display")
)
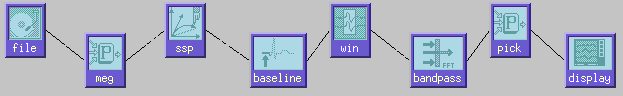
“display”
こんな感じになります。ベースラインは−50〜−10msec、周波数帯域通過フィルタは2〜100Hzです。
SSPをかけます。
(progn
(setq
ssp-vector-directory "/neuro/data/case00/")
(ssp-popup)
)
nil
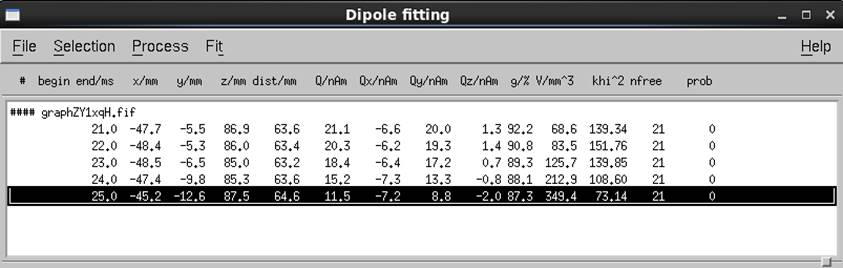
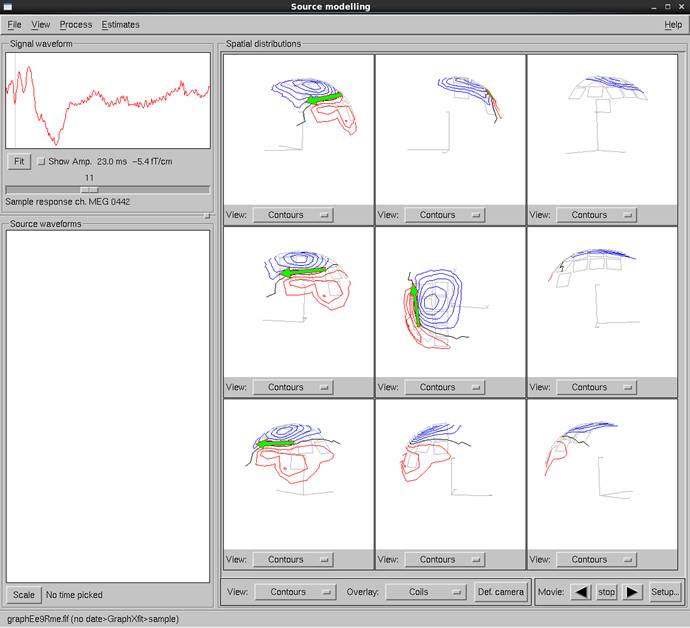
23msecの等磁場線図と21〜25msecまで1msec間隔で単一電流双極子推定を行いました。
(progn
(use-selection "Vectorview" "left-parietal" pick display)
(set-resource display
:selection-start 0.0 :selection-length 0.5)
(xfit)
(xfit-command
"fixorigin")
(xfit-transfer-data)
(xfit-command
"origin head -3.48 12.00 44.75")
(xfit-command
"pick 23")
(xfit-command
"fit 21 25 1")
)
“OK”