Auditory evoked field
Binaural stimulation by 1kHz tone burst.
Interstimulus interval was 2.5 second and about 100 trials were averaged.
evoked field waveforms
3D evoked field waveforms
isofield contour map at 80 msec after stimulus
isofield contour map at 83 msec after stimulus
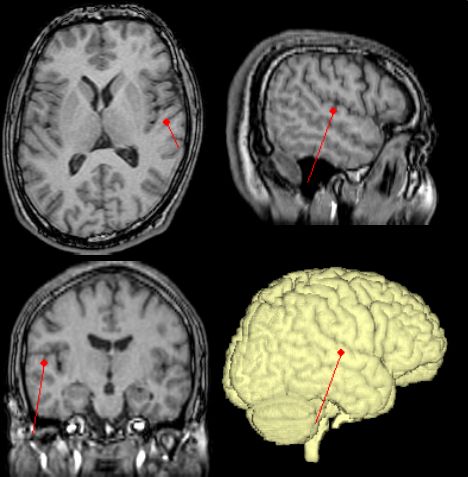
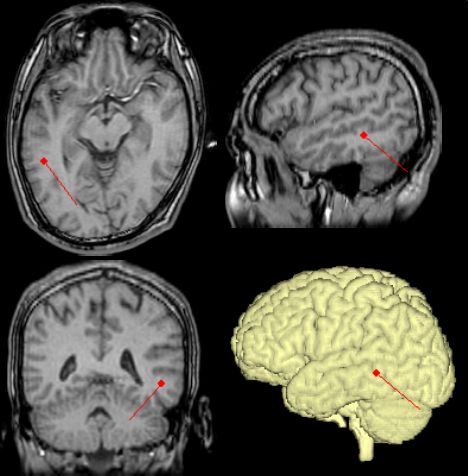
An estimated dipole at 80 msec in the left hemisphre
An estimated dipole at 83 msec in the right hemisphere
isofield contour map 0-300msec (GIF 1,180kB movie)
or (MPEG1 1,214kB)
Movies of Minimum Current Estimation (GIF 644kB) or
(MPEG1 2,143kB)
Waveforms of auditory evoked field

MEG waveforms from -50 to 500 msec are overlaied to the sensor array.
Waveforms of planar type gradiometers are shown in blue, and those of magnetometers are shown in green.
Isofield contour map at 80 msec after stimulation.
Inflow flux is shown in blue and outflow flux is shown in red
Isofield contour map at 83 msec after stimulation.
Inflow flux is shown in blue and outflow flux is shown in red
With left temporal channles, a single dipole estmation was undertaken, and overlaid to MRI.
The subject was the author.
It is not known exactly why dipoles estimated from the left auditory response always locate
not near Heschl's transverse gyrus or planum temporale, but in more caudal temporal lobe.
With right temporal channles, a single dipole estimation was undertaken, and ovalaid to MRI.
The dipole is estimated at planum temporale.